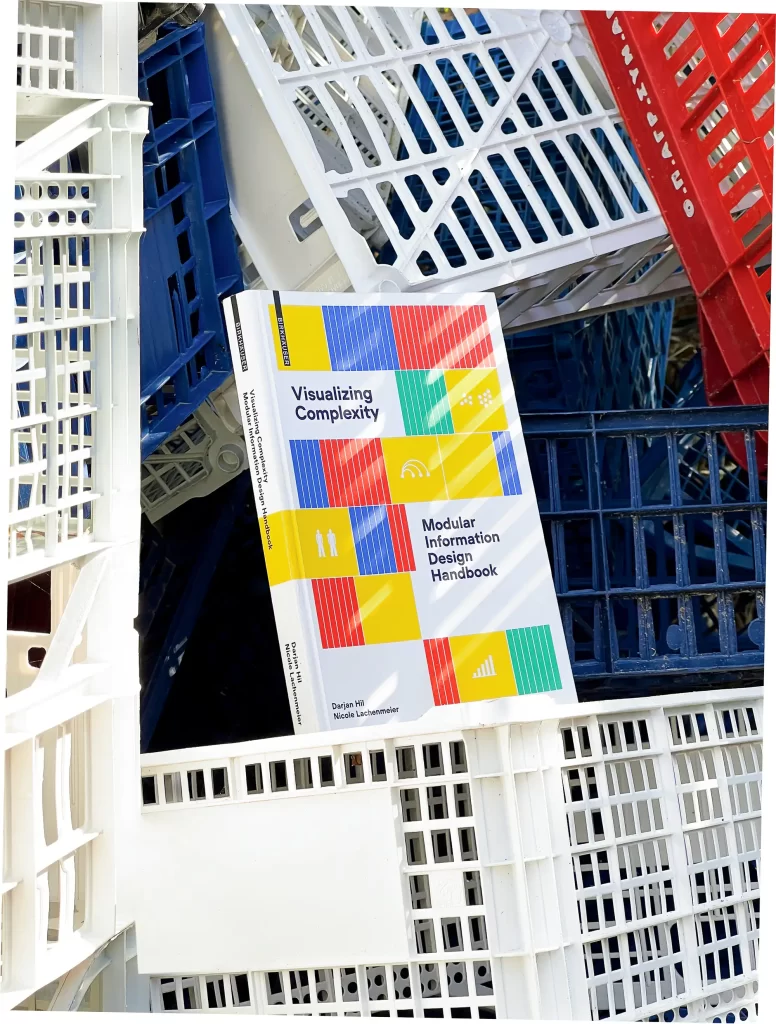
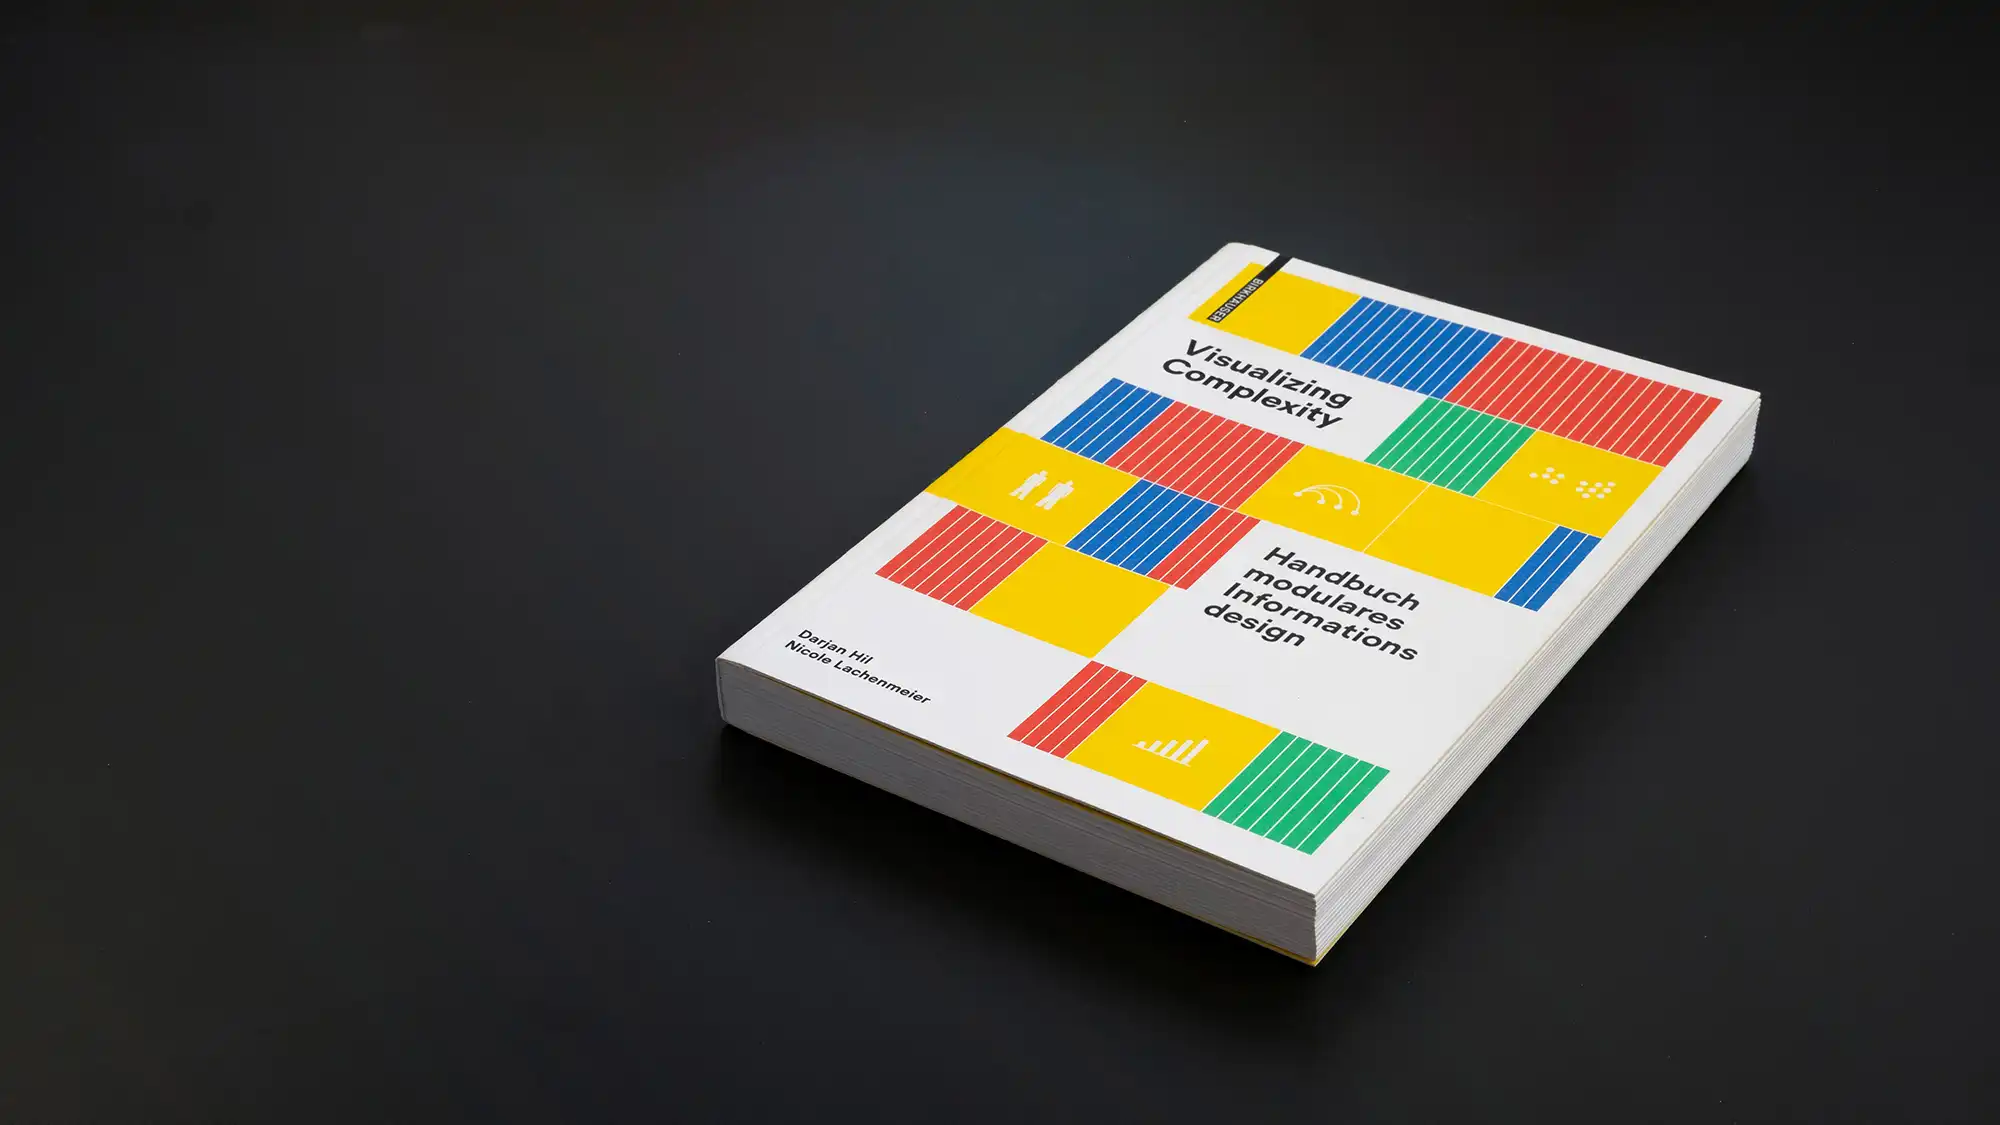
In the comments column of the Kickstarter campaign for the book "Visualizing Complexity", people from Baltimore, India and Finland write. "Looks stunning, I'm so happy I backed this project," Miki says happily; it fulfills the promise of a usable, timeless handbook for modular information design.
For Basel-based studio Superdot, the immense effort seems to have paid off - insights from many years of work experience in design, analysis and consulting flowed into the publication. For the current issue, we were able to ask Darjan Hil and Nicole Lachenmeier a few questions about their passion for complex issues and attractive data design.
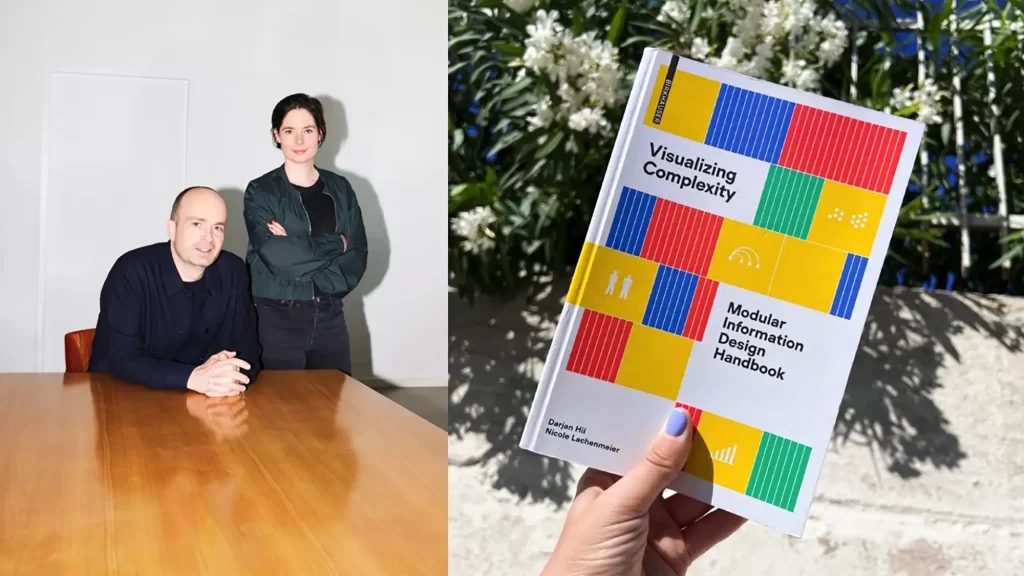
Darjan and Nicole, let's start in general terms: What do you wish for the future of information design?
Darjan: I hope that information design will be recognized as a universal discipline and problem-solving method that can automatically make a significant contribution to finding solutions by visualizing a wide variety of problems. However, this still requires a lot of rethinking and education of potential clients and of all designers themselves.
Nicole: That more designers dare to work with data and that the discipline of data visualization becomes even more important in design and is not just left to scientists and journalists.
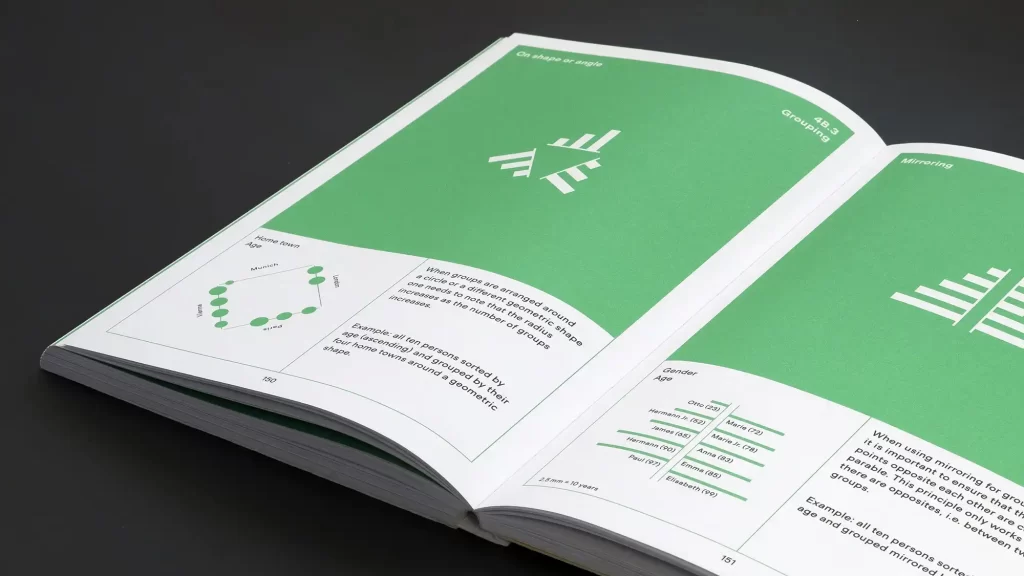
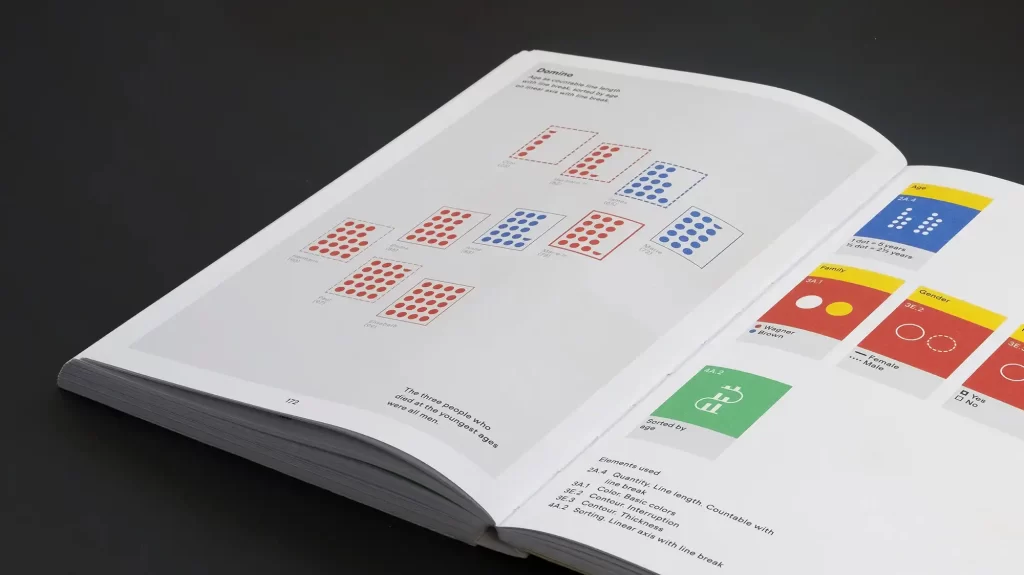
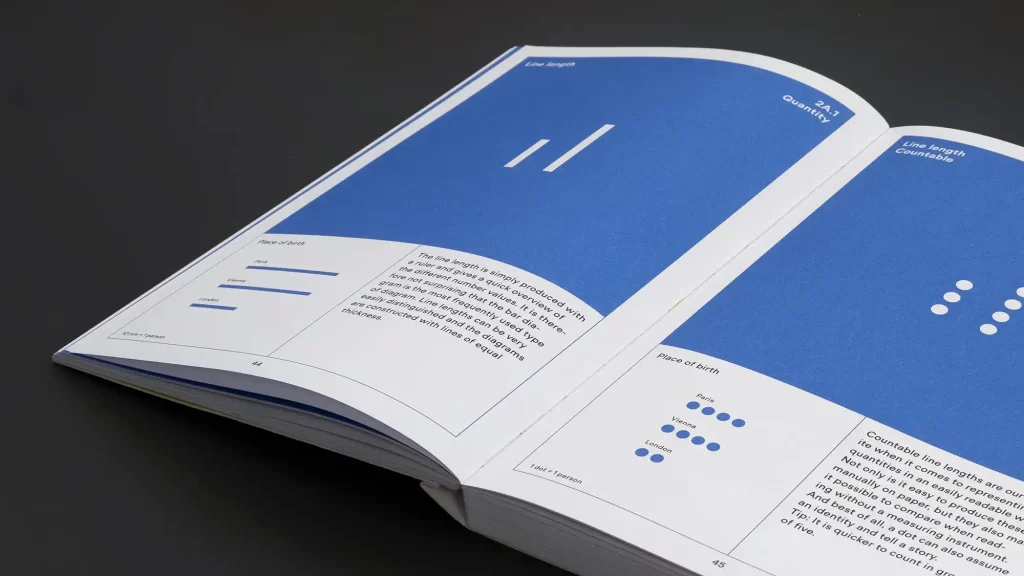
Your book addresses this gap, bringing together ten years of practical experience with the interface discipline of information design. Why is the topic particularly topical and relevant for you at this time?
Darjan: It took us a few detours and project experiences to realize that our successful working practice differs from that of other agencies and from the approaches in the current literature. The current literature on data visualization is very rule-based, just like today's algorithms, bots and all the other tools that promise us quick solutions.
Nicole: We want to work through systematic design with a deliberate use of elements, similar to an analog algorithm. It's not about right or wrong, but about systematically creating variants and then assessing whether it works.
Darjan: It's an analytical examination of the material and the tools, similar to the way the Bauhaus movement was taught. We try to pass on to our students that the data is the raw material and the modular information design is the tool to present it aesthetically, but without falsifying the data.
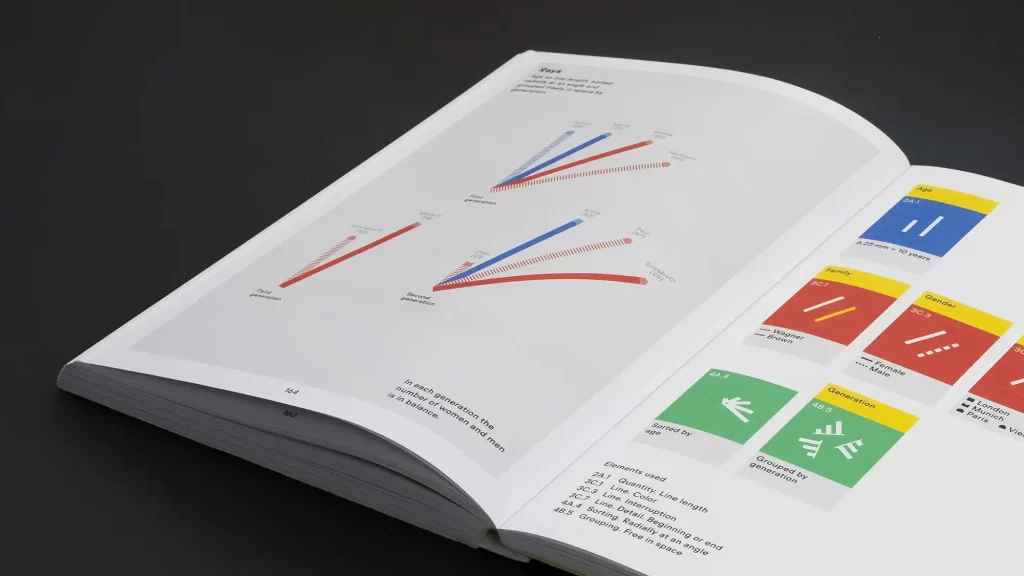
How was your experience with the Kickstarter campaign? Was there a visible need for your heartfelt cause?
Darjan: It took a lot of courage for us to overcome ourselves to write such a different book and then to put it on a platform that has become known for pre-selling technological gadgets. We honestly didn't believe that so many people would support the Kickstarter campaign. We were surprised that we sold 150 books within 24 hours and that the Kickstarter team in San Francisco chose us as their "Team's Favorite Project". From that point on, things took off. After four weeks, we had over 700 backers from over 30 countries.
Nicole: The Kickstarter campaign was a great way to check whether there is a community for Visualizing Complexity. As an agency, we also like to break new ground and challenge existing structures. In my view, it is essential that the current multiple crises are considered together and not played off against each other.

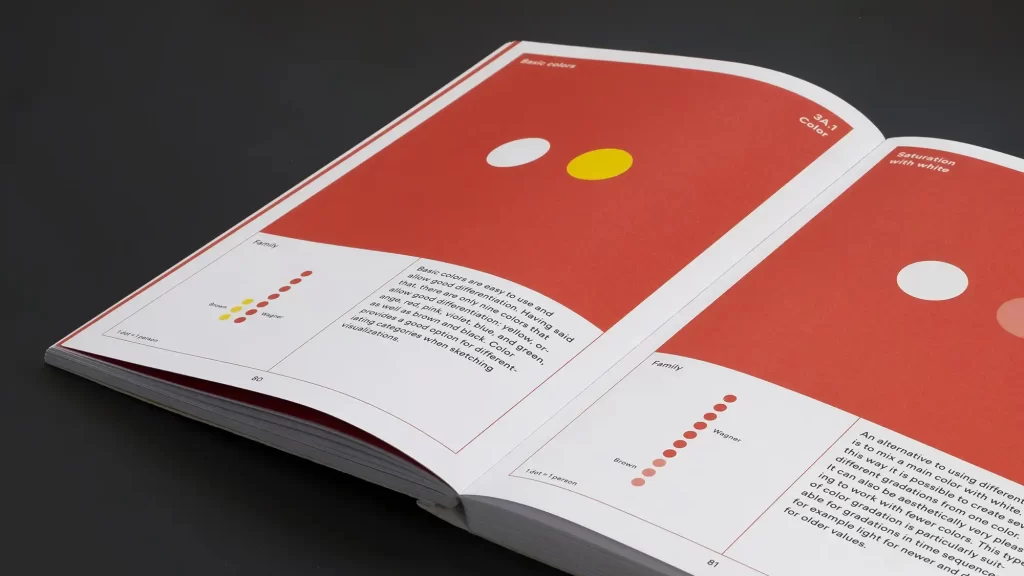
Do you see the potential for people to get more information from visual sources instead of reading long newspaper texts, for example?
Darjan: Absolutely. Not necessarily only in a positive way. We think that text and images need to coexist nicely and that in-depth visualizations need some time to be understood. Discovering new insights requires your own mental work and remains in your memory much longer as a sense of achievement. When everything is moving faster, this is not necessarily advantageous for multidimensional visualizations. The faster a visualization is supposed to work, the less data should be used.
Nicole: The challenge is to get people's attention for a visualization. We are convinced that aesthetics and data experience design help with this.
The joy of correct, but also creative work - why do designers so often seem to have problems combining the two?
Darjan: When designers move away from a purely aesthetic implementation activity into the position of an interface, there are always rank battles. Journalists, data scientists, statisticians, strategy consultants and many other professions want to assert their place and expertise. Visualizing information, on the other hand, means that gaps may become visible. This can be seen as an attack and requires courage and communication skills from designers. Designers, on the other hand, often lack the vocabulary in another discipline and then the space is not taken up that we are entitled to, namely to question things and make them communicable. It's easier to decorate something than to swim against the tide and show that something isn't quite clear, because then it's probably not clear to other people either.
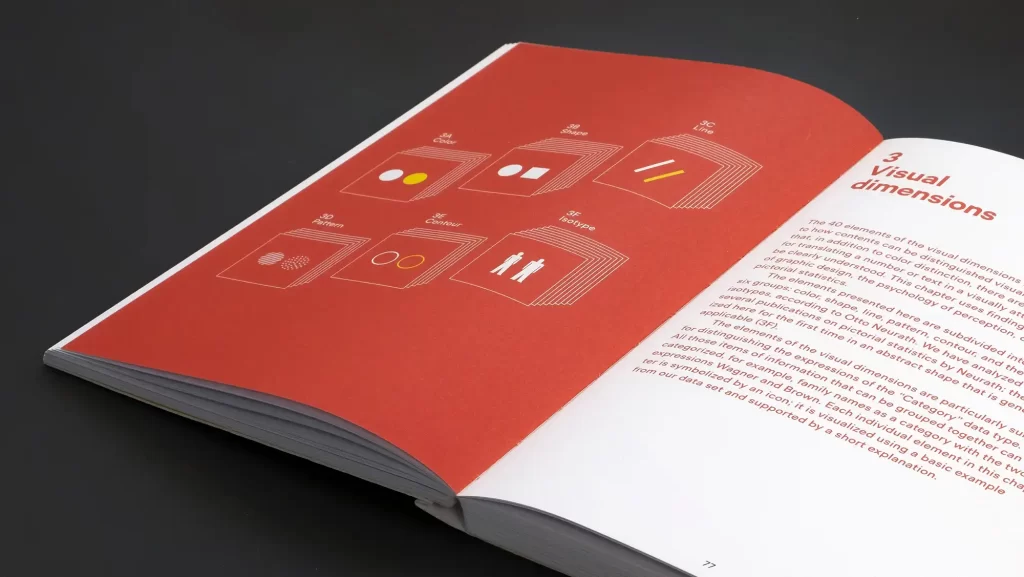
Your book is a testament to this and is incredibly beautifully designed. How long did you work on it and how did you go about designing it?
Nicole: It took almost exactly two years from the first sketch to the point where we were able to hold the book in our hands once it was printed. We first sketched the entire MID system by hand. Working analogously slows us down and helps us to think. At some point, we no longer wrote down the hours that we then spent on the digital fine-tuning. We developed the texts and the system at the same time, because text and image are very closely linked for us.
What projects are you currently working on as Superdot that make use of your knowledge?
Nicole: We are currently working more on the web again and are developing a platform for an organization to make the data of its partner institutions publicly accessible. Data can also be text, not just numbers. We are also experimenting a lot with new technologies and are developing an augmented reality application for 3D visualization for another customer. The MID system also helps us to make conscious design decisions in the digital field and to bring multidimensional levels of information into context.
Darjan: We are also currently working on a project to build a web platform that uses data visualization to provide the public with overviews of ongoing digital transformation projects in the canton.
More about Studio Superdot from Basel
Buy the book "Visualizing Complexity" now
Here is more information about the Studio Superdot community event on March 3, 2023
